Media Library
This is a learning library as well as a means to share media tools. Below are reels, graphics, documents, and other files that are useful for training or are otherwise advocating for flood risk management.

Videos
Why say structural and nonstructural?
Technical experts say these terms when forming alternatives that address flood hazards. Understanding why will help you on your flood management planning effort. Maybe we can start using the terms features and activities for these measures that manage flood risks?
Three Things You Should Know About … Levees!
This is the first reel of many, where we will spotlight one measure, or some aspect about flood risk management, and point out Three Things You Should Know About it.
Watch for more in the future!
Flood Map Limitations
Flood maps aren’t perfect. They have limitations tied to stream gage and precipitation records.
The Flood Management Planning Process
Flood insurance rates have become actuarial rates in the United States over the last several years within the NFIP. This reel is about floodplain management plans and the planning process behind them. This is a way to lower insurance premiums through the FEMA NFIP Community Rating System, Activity 510. Earn and accumulate points to lower rates community-wide. Adopting a floodplain management plan can change your community a whole class level in CRS!
Music by Nigel Stanford. Used with permission.
Photos
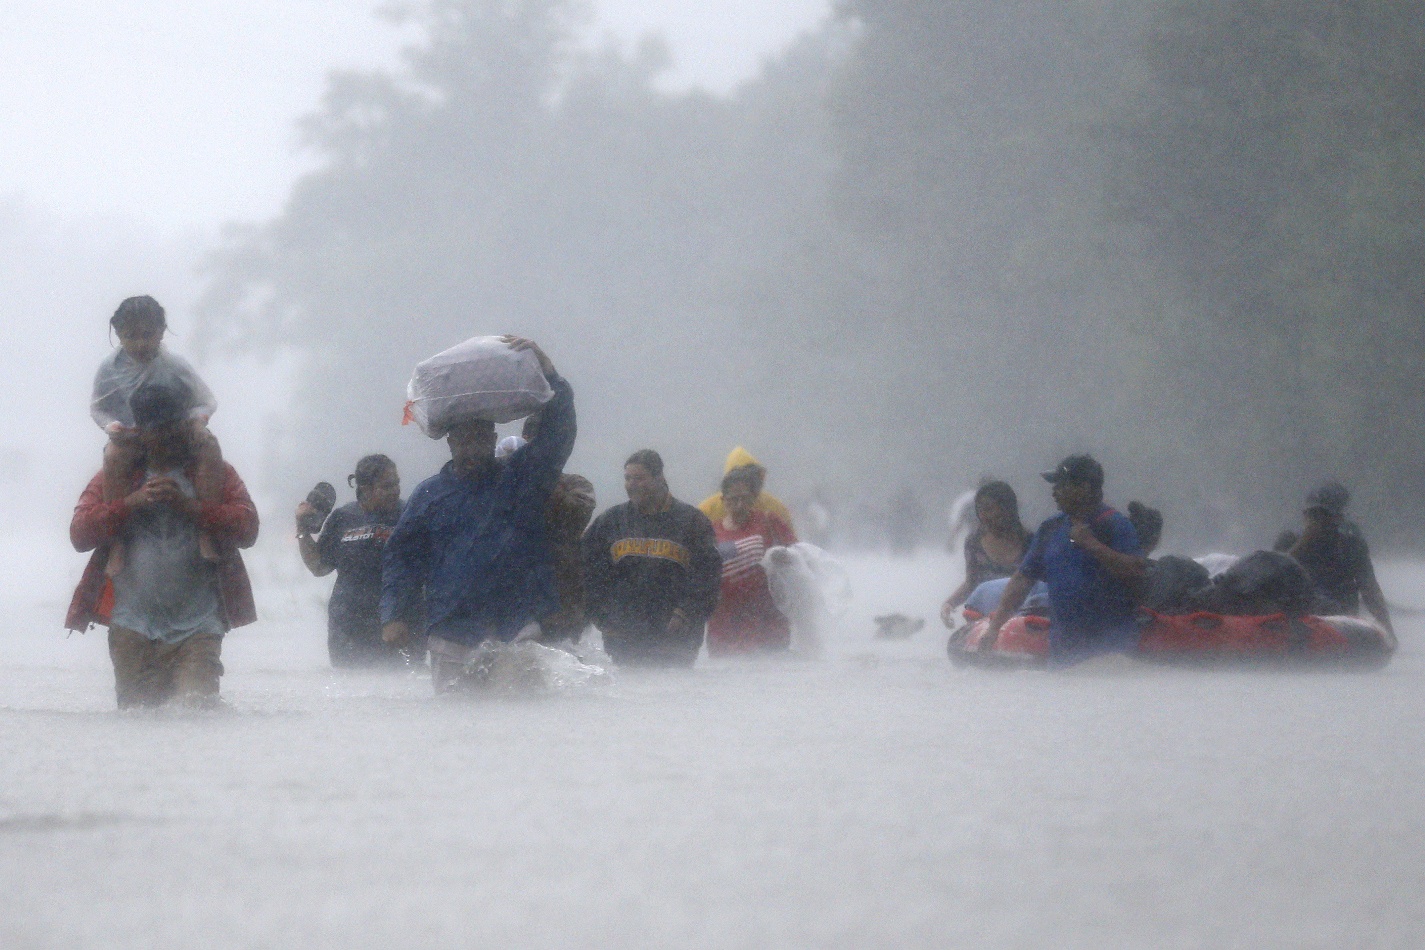
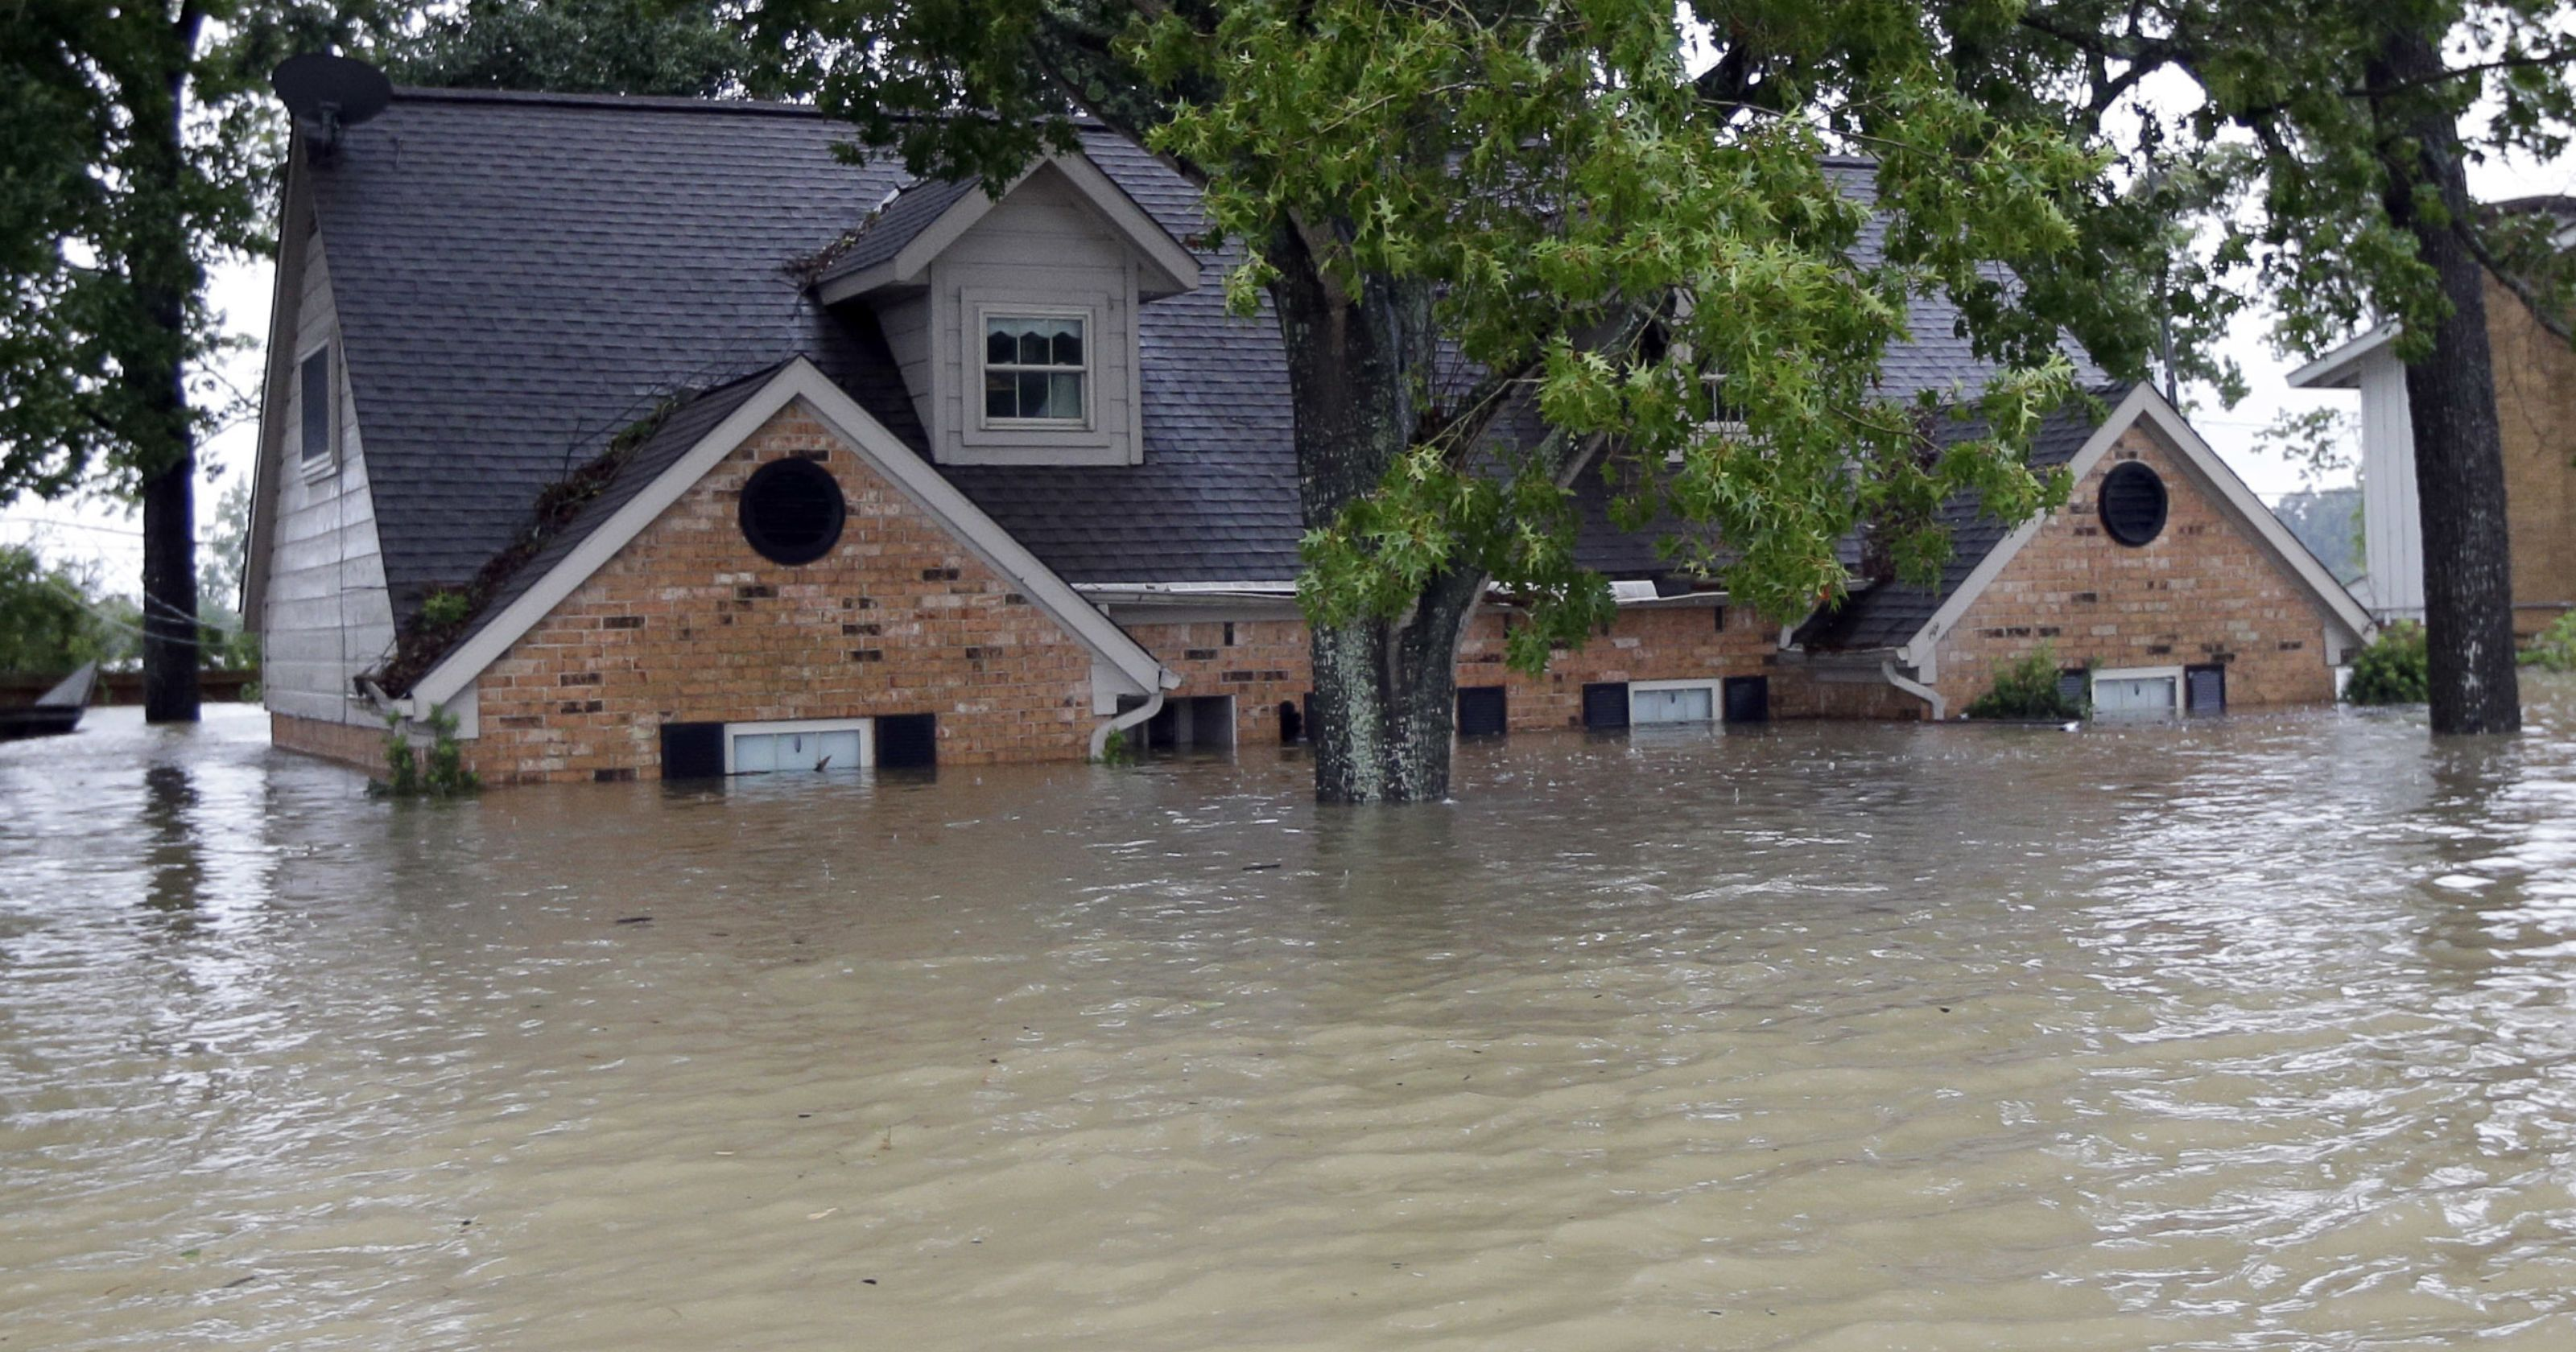
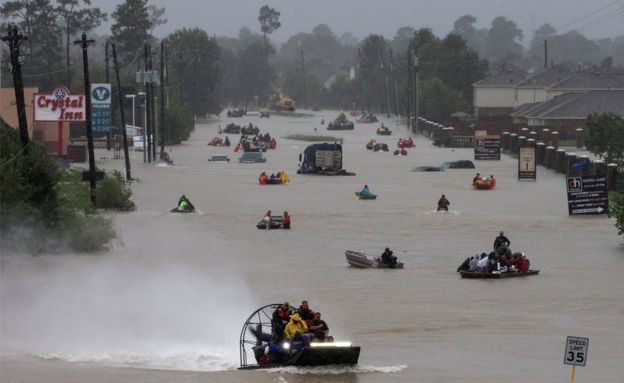
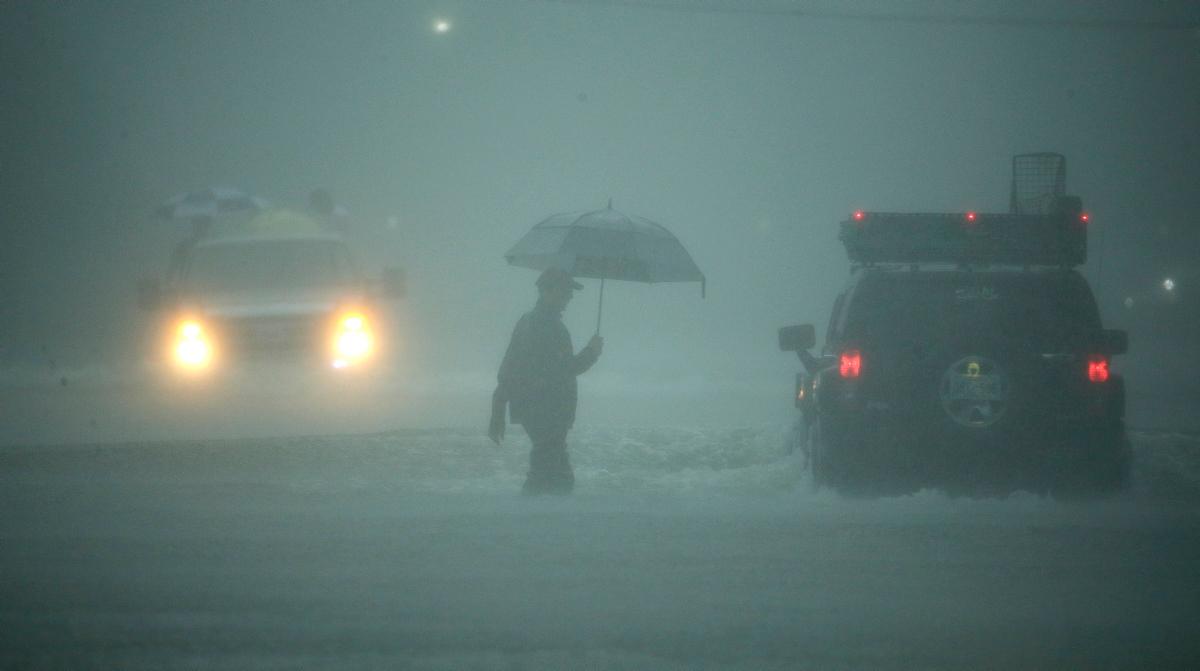
Various photos from Hurricane Harvey impacts, August 28, 2017
Flood Forecast Inundation Mapping
Flood forecast inundation maps are a flood warning tool and map of potential inundation areas. This tool is a great example of interagency partnerships is the one between USACE-USGS-NWS and the state and local communities. These maps show the continuum of risk, rather than the in-out that FEMA Flood Insurance Rate Maps (FIRMs) are focused on for regulatory purposes. To use these types of National Water Prediction Service webpages, open the webpage, then skip down 3 items to the Gauge Location map. Below it, click the dial Activate Partner <Name> FIM. Another step, recommended for better visibility: Click the layers button in the upper right of the map to switch to an aerial map, giving contrast to the light blue inundation layer. Additional dials below the map can activate the FEMA overlay of the FIRM.
Example FFIMs
- FFIM KS Manhattan Big Blue River
- FFIM KS Manhattan Wildcat Ck
- FFIM KS Ottawa MDC River
- FFIM KS Rossville Cross Ck
- FFIM KS-MO Leavenworth MO River
- FFIM KS-MO Parkville MO River
- FFIM MO Independence Little Blue River
- FFIM MO Lake City Little Blue River
- FFIM MO Waynesville Roubidoux Ck
Why Should We Consider These FFIMs as a Valuable Tool for Reducing the Nations’ Susceptibility to Flood Hazards?
- A map-book, showing the continuum of flood risk.
- Visual for where flooding will happen at publicly familiar gage location
- Link for public between forecasts, flood warnings, and action
- Knowledge of future flood levels and when to flood fight, preventing costly, unnecessary efforts for preparedness
- Tool for risk informed decision making
- All-the-time, continuous and dependable availability and risk communication (available 24 hours a day and 7 days a week)
- Nonstructural measure for improving public risk knowledge
- Interagency effort that leverages existing tools and abilities of multiple agencies with roles in managing flood risks
- Flood map that does not limit risk informed decision making to the regulatory flood extents or flood elevation
- Consistent and same standards are part of how every single flood forecast inundation map is made, which keeps up public trust
Handout promoting flood forecast inundation maps
Posters
This is a tip for professional practitioners in FRM to consider: Posters at professional conferences are a great way to communicate ideas and success stories. The posters below were created to increase networking at the floodplain manager conference in 2025. The original idea was to use a concept by Dr. Mike Morrrison, who pointed out the poster coloring and main statement at the time could serve to speed up cross-sector networking. This is important to move the field of flood risk management to more effective and collaborative actions, which are needed to address increasing flood risks. These posters are only an excerpt of the over 40 posters the Silver Jackets teams posted here.
Healthy watersheds
This poster is based on HUC-10 watersheds and activities conducted at the watershed-level. In this case, agricultural areas, which make up a substantial portion of Midwest watershed areas, are assessed with a hydrologic model to see whether watershed-wide soil health management systems (NRCS) measures have a meaningful reduction in flood flows.
Local Hazard Mitigation Plans
The poster here examines two specific hazards the state had identified under flood risk management and then assessed the inventory of actions. The inventory was useful in considering how a watershed approach could be a more effective arrangement than multi-county. The assessment also helped account for possible budgets necessary for studies to address the needed actions.
Flood forecast inundation mapping
Flood awareness tools take many forms, but few reveal the continuum of risk as well as flood forecast inundation maps.
Watershed-level Assessment of Consequences
The use of available FEMA RiskMAP depth grids can be leveraged along with the National Structure Inventory to provide state agencies with consequences data. That enables risk informed decision making by the state leads, who need to be sure grant opportunities go to address the areas of highest flood risk.
Repetitive Area analysis in a small watershed
Formulating plans to fund projects in a watershed can be challenging without a systems approach. This poster shows the hydraulic modeling updates and tying together buyout opportunities that are needed.
Historic Flood Sign Examples
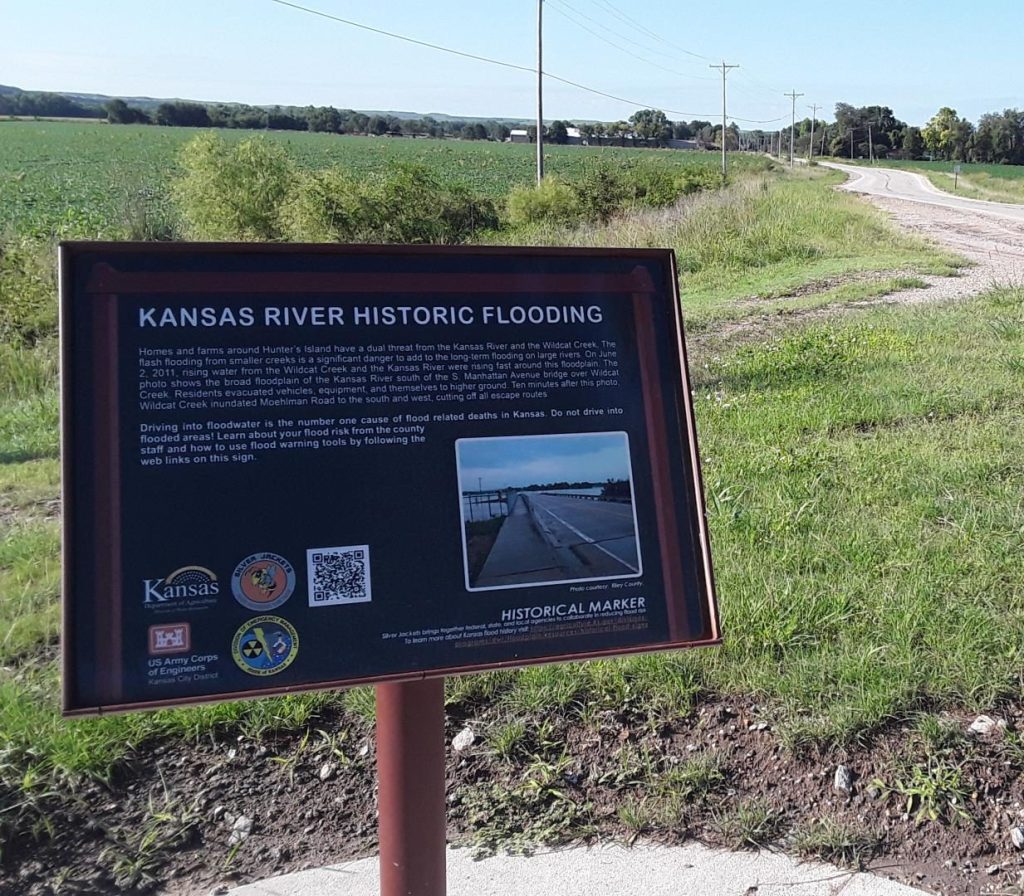
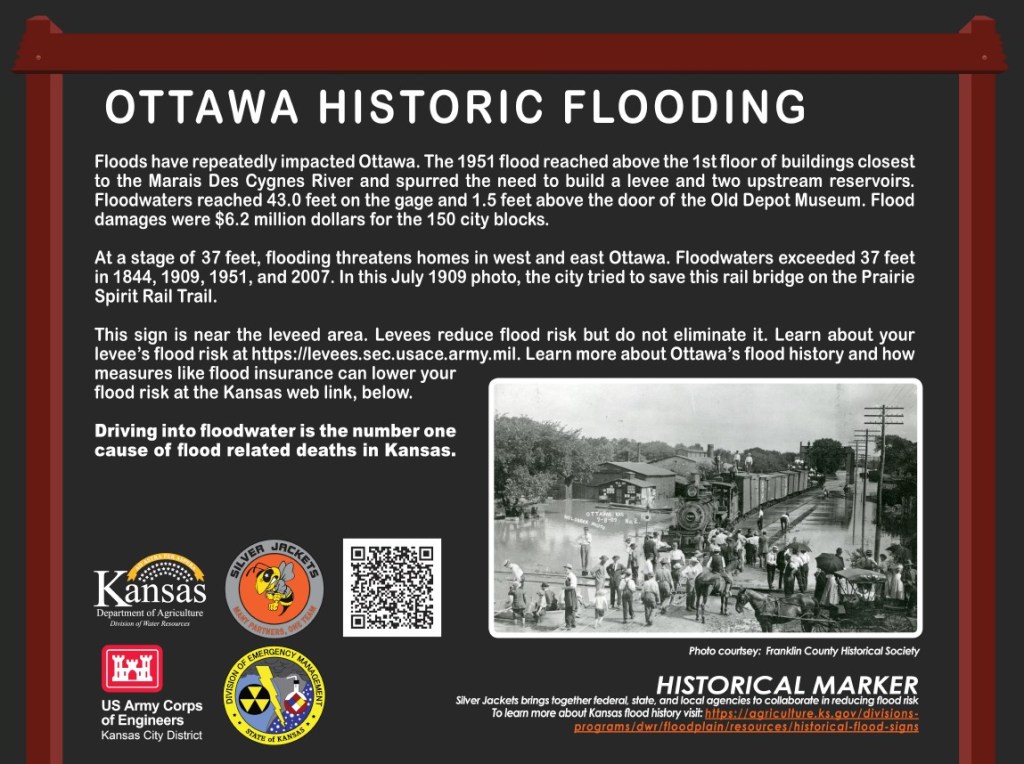
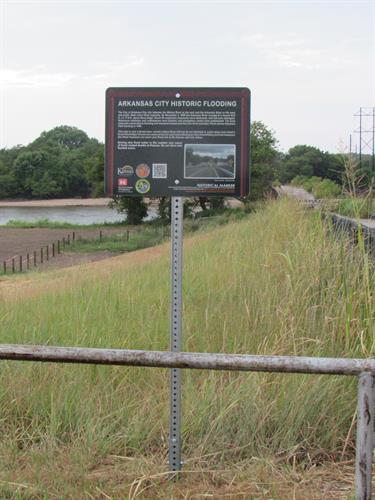
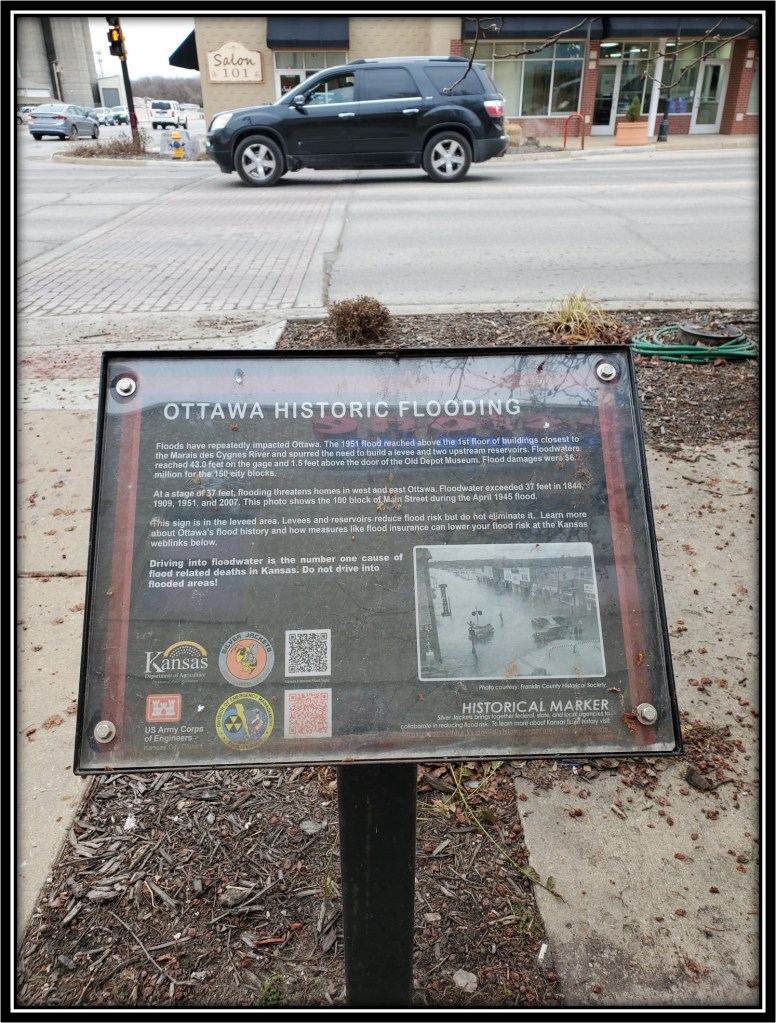
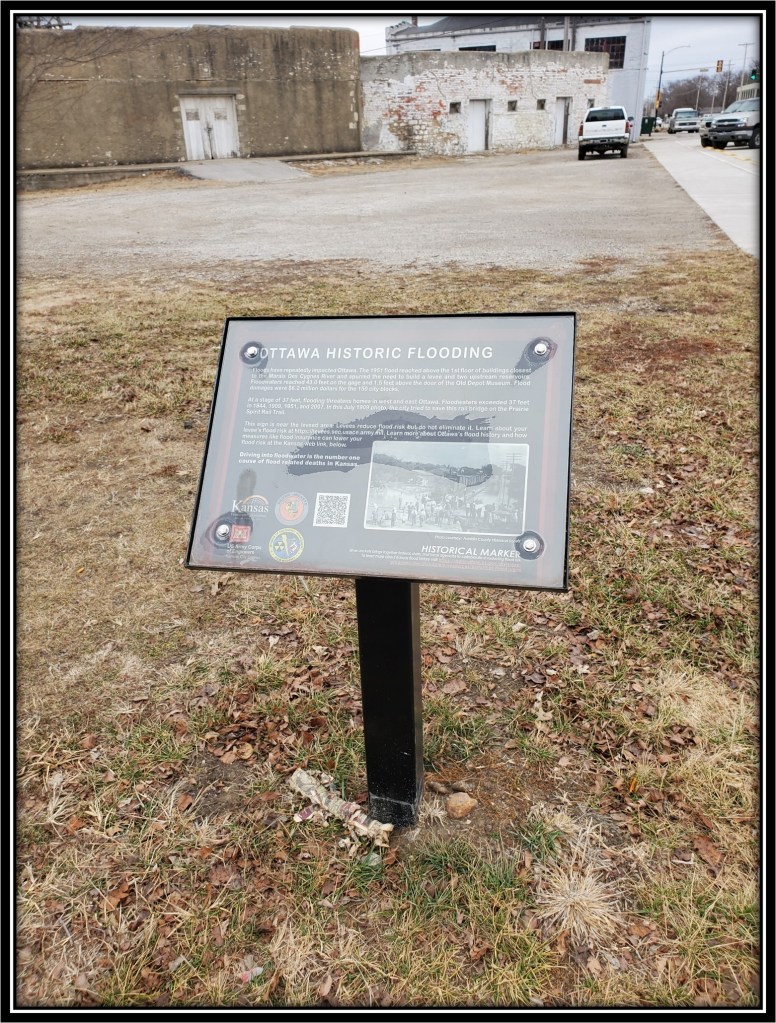
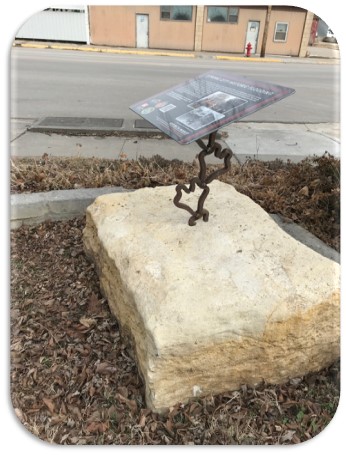
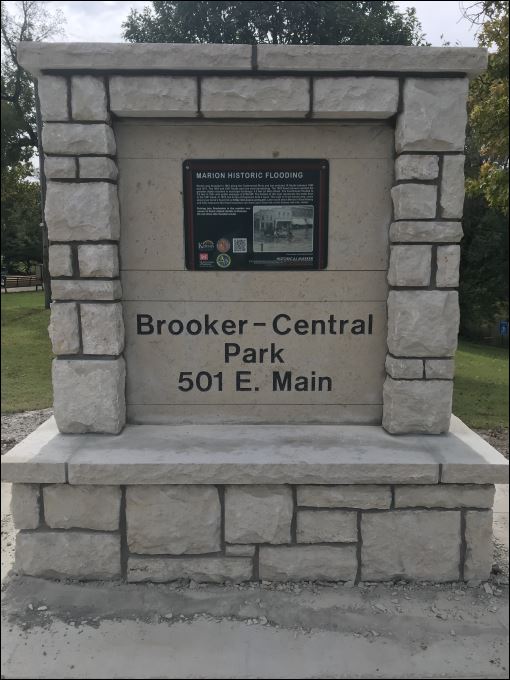
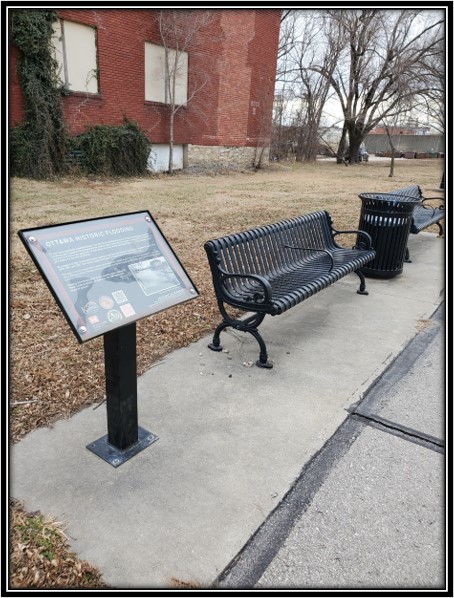
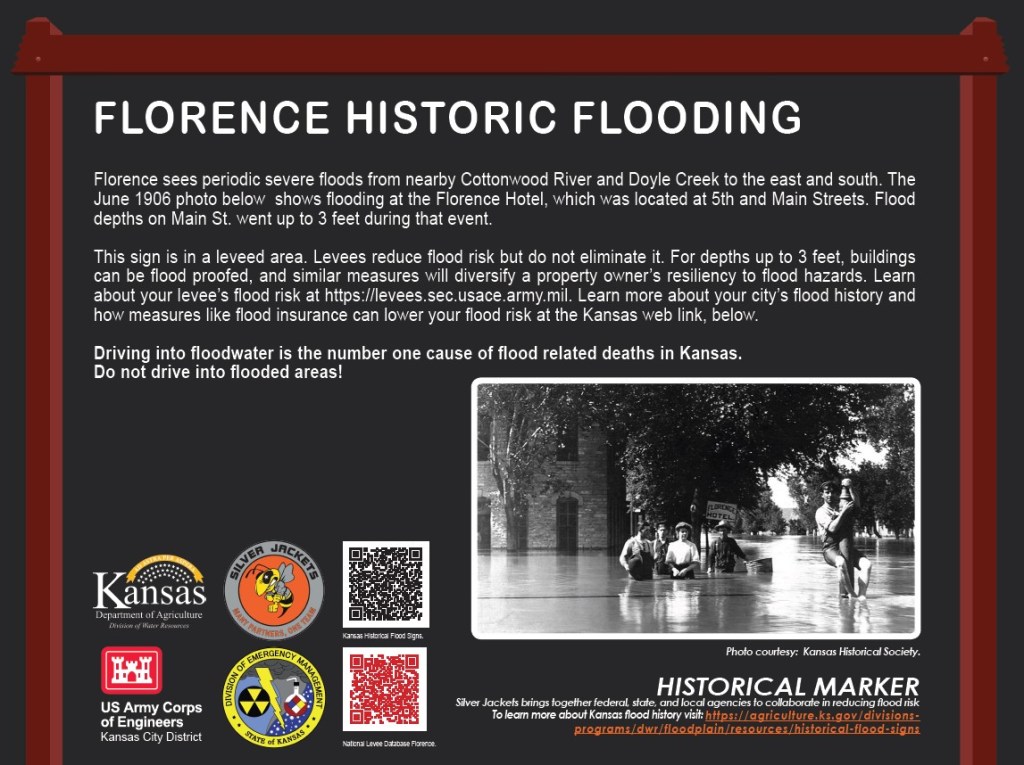
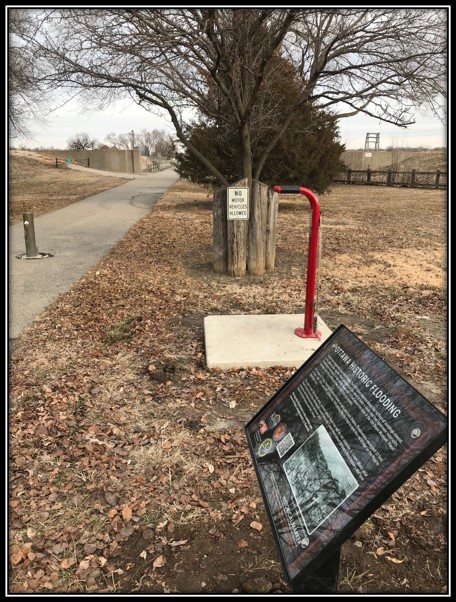
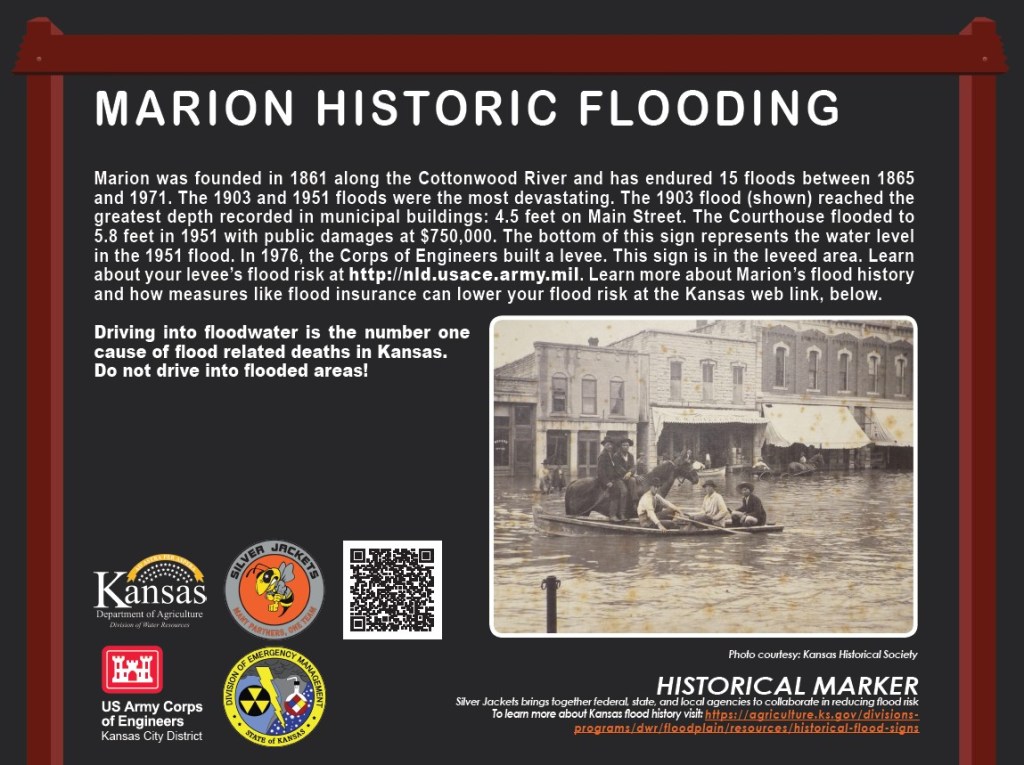
Any community can succeed with flood awareness techniques, and one way is a historic marker to remind the public of flood risks. These signs were used for communities in Kansas in 2018 to remind the public of past highwater marks and the disasters they caused. While the story of the area surrounding the sign is one part, the real impact is found when you can visually see where the highwater mark was from the sign. These signs specifically describe that element of the story, giving the reader a take-away about the risk.
For the examples below, a total of 24 signs were developed for 17 communities in Kansas. Missouri established 9 signs across the state (not shown below) in 2019. Many of the communities’ staff became very excited and developed exotic mounting techniques. One community had four signs and did a flood tour.

(Paywall) Graphics, Spreadsheets, PowerPoints
Topics include
- Flood Risk Management Measures mindmap
- FRM Roles and Responsibilities spreadsheet
- Floodplain manager survey of needs
- Floodplain management plan tri-fold handout for public engagement
- Leadership integration paradigms
- Historic Flood Sign template
- Example nonstructural analysis for a floodplain
- Emergency action plans template
- Community engagement and public involvement tools
- Interagency efforts for floodplain management and hazard mitigation plans
- Best practices for mitigation teams
- and more
Subscribe to get access
Read more of this content when you subscribe today.

